Aria Ops: Reporting from the API

Have you ever wished you could see your infrastructure’s performance data in more detail than the standard hourly reports? I did too. That’s why I built a simple PowerShell solution that leverages the Aria Ops API to pull metrics at 5-minute intervals—giving you access to a level of insight that out-of-the-box reports just can’t match.
The Problem with Standard Reporting
Out of the box Aria Ops reporting is great — but it has its limitations, namely the native reports only offer data granularity down to the hour. When you’re troubleshooting performance issues or fine-tuning capacity planning, hourly snapshots can miss critical short-term spikes or dips.
By calling the Aria Ops API directly, you can pull data at much finer intervals (e.g. every 5 minutes), giving a much more detailed picture of your infrastructure’s performance.
How It Works
Input File Setup:
You need to create two CSV files. One which instructs the script what types of objects you are interested in and the metrics to gather for them. A second CSV file details which objects to gather data on.- Objects CSV: Contains objects with columns
ObjectNameandResourceKind.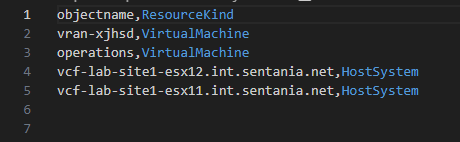
- Metrics CSV: Maps each resource kind to the specific
statKeyvalues you wish to query (e.g.cpu|usage_averageandmem|workload).
- Objects CSV: Contains objects with columns
Authentication & Inventory Retrieval:
The script authenticates to your vROps instance and retrieves the full resource inventory. This includes both Virtual Machines and Host Systems.Batch API Queries:
The script batches resource IDs into a single GET request, reducing network overhead.Data Processing & CSV Output:
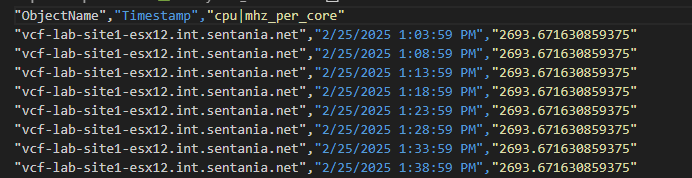
The returned JSON is parsed and aligned by timestamp (down to 5-minute intervals), and a CSV file is generated for each resource type. This script is designed to support multiple object types! It will output a csv file for each object type you query!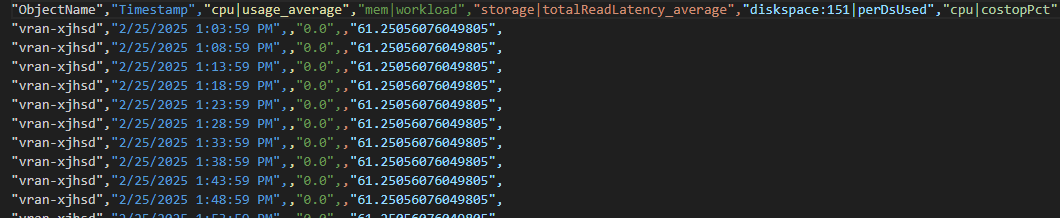
Example Usage
Prepare the needed input CSV files. If you aren't sure what metric you are looking for, you can query the included dictionary files for the name of the metric. Then, run the script with a command similar to:
1.\Get-vROpsMetrics.ps1 -vROPSUser admin -vROPSpasswd P@ssw0rd -vROPSFQDN operations.example.com `
2    -StartTime "2025-02-20T00:00:00" -EndTime "2025-02-20T23:59:59" `
3    -RollupInterval MINUTES -RollupType AVG `
4    -ObjectCsv "C:\Inputs\objects.csv" -MetricsCsv "C:\Inputs\metrics.csv" `
5    -OutputDirectory "C:\Outputs"
This command pulls metric data at 5-minute intervals (by setting RollupInterval to MINUTES) instead of the default hourly granularity, letting you dive deeper into performance trends.
Final Thoughts
This PowerShell script gives you a powerful, flexible way to extract granular performance data from Aria Ops. Whether you’re investigating transient performance issues or need detailed historical data for capacity planning, having metrics at 5-minute intervals can be a game changer. Feel free to download it from my GitHub repository.